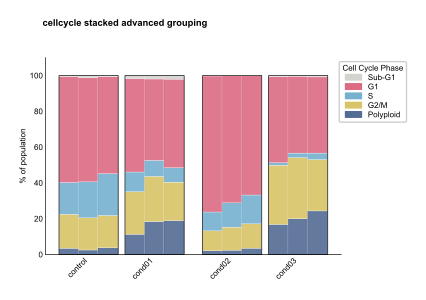
Cell cycle stacked plots
The cell cycle stacked plot provides unified visualization of cell cycle phase distributions using stacked bar charts with options for summary statistics or individual biological replicates.
See the API reference for full signatures and parameter documentation.
Examples
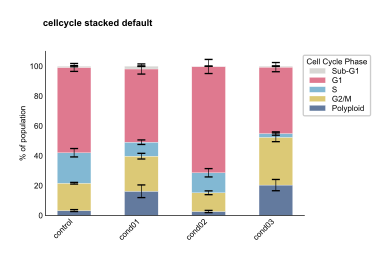
Basic Stacked Distribution
Create a standard stacked bar plot showing cell cycle phase proportions with error bars:
from omero_screen_plots import cellcycle_stacked
import pandas as pd

df = pd.read_csv("data.csv")
fig, ax = cellcycle_stacked(
    df=df,
    conditions=['control', 'cond01', 'cond02', 'cond03'],
    condition_col="condition",
    selector_col="cell_line",
    selector_val="MCF10A",
    title="Cell Cycle Phase Distribution",
    save=True,
    file_format="svg"
)
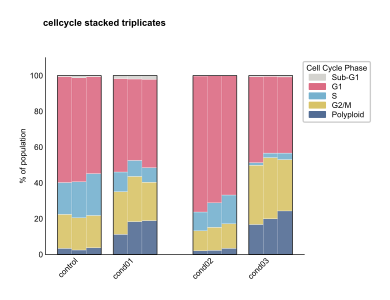
Individual Triplicates Display
Show individual biological replicates to assess experimental consistency:
fig, ax = cellcycle_stacked(
    df=df,
    conditions=['control', 'cond01', 'cond02', 'cond03'],
    condition_col="condition",
    selector_col="cell_line",
    selector_val="MCF10A",
    selector_val="MCF10A",
    show_triplicates=True,
    group_size=1,
    title="Cell Cycle - Individual Replicates"
)
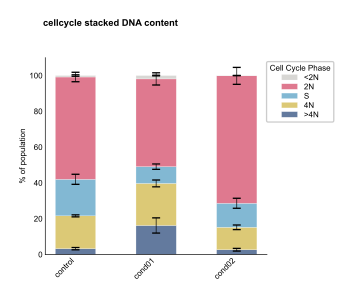
DNA Content Focus
Emphasize DNA content measurements with custom phase selection:
fig, ax = cellcycle_stacked(
    df=df,
    conditions=['control', 'cond01', 'cond02', 'cond03'],
    condition_col="condition",
    selector_col="cell_line",
    selector_val="MCF10A",
    selector_val="MCF10A",
    phase_order=['SubG1', 'G1', 'S', 'G2/M'],
    title="DNA Content Distribution"
)
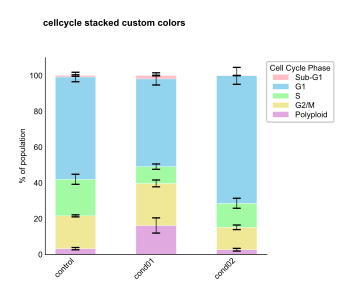
Custom Phase Colors
Apply custom color schemes for publication figures:
from omero_screen_plots.colors import COLOR

phase_colors = [COLOR.LIGHT_BLUE.value, COLOR.BLUE.value,
                COLOR.GREY.value, COLOR.DARK_GREY.value]

fig, ax = cellcycle_stacked(
    df=df,
    conditions=['control', 'cond01', 'cond02', 'cond03'],
    condition_col="condition",
    selector_col="cell_line",
    selector_val="MCF10A",
    colors=phase_colors,
    show_legend=True,
    title="Custom Cell Cycle Colors"
)
Grouped Condition Analysis
Group related conditions for treatment comparison:
fig, ax = cellcycle_stacked(
    df=df,
    conditions=['control', 'low_dose', 'med_dose', 'high_dose'],
    condition_col="condition",
    selector_col="cell_line",
    selector_val="MCF10A",
    show_triplicates=True,
    group_size=2,
    within_group_spacing=0.2,
    between_group_gap=0.5,
    title="Dose Response Analysis"
)